

Starter project
This walkthrough uses the E1 Weather Agent example repository to demonstrate how to add E1 observability to a small LangChain application. The application is a TypeScript Node.js agent that uses Google’s Gemini model and a custom weather tool. The Ellipsis SDK captures supported execution events through a LangChain callback handler and exports telemetry to E1.The
get_weather tool in this example returns a fixed demonstration string.
It does not call a live weather API or provide real weather data.What you will build
The example combines:- E1 SDK — instrumentation and trace export.
- LangChain — agent creation and tool orchestration.
- Google Gemini —
gemini-2.5-flashmodel. - TypeScript and Node.js — application runtime.
- Zod — schema definition for the tool input.
Prerequisites
Before starting, make sure you have:- Node.js 22 or later.
- An E1 account and a valid agent API key.
- The E1 ingestion URL from the API reference.
- A Google AI API key.
1. Get the example project
Clone the repository and move into the project directory:2. Configure your environment
Create a.env file in the project root:
ELLIPSIS_INGESTION_URLidentifies the E1 telemetry ingestion endpoint.ELLIPSIS_AGENT_API_KEYauthenticates the application and associates its telemetry with the E1 agent.GOOGLE_AI_API_KEYauthenticates requests to Google Gemini.
3. Initialize the E1 SDK
The example loads environment variables withdotenv, then creates the E1 configuration:
Agent-Weather-Tool project, version 0.1.0, running in the DEV stage.
4. Create the LangChain instrumentation handler
Initialize the SDK at the top level of the application and create its LangChain handler:"info" argument sets the SDK logging level for this example.
The call to ellipsis.langchain() creates the callback handler that will be passed to the agent invocation.
5. Define the weather tool
The example defines a tool namedget_weather. It accepts a city as a string and returns a demonstration response:
6. Configure the Gemini model
The example uses Google’sgemini-2.5-flash model through the LangChain Google integration:
7. Create the agent
Create a LangChain agent with the Gemini model and the weather tool:get_weather in response to a user message.
8. Invoke the agent with E1 instrumentation
The final step is to pass the Ellipsis handler to the agent invocation:callbacks option is the connection point between the LangChain execution and the Ellipsis SDK. The handler captures supported events emitted by the framework and exports the resulting telemetry to E1.
9. Run the example
The repository provides a development script:tsx.
The project is configured as ESM-first and also includes scripts to build and run ESM and CommonJS outputs:
10. Inspect the execution in E1
After the agent has executed and telemetry has been exported:- Sign in to E1.
- Open the organization workspace containing the agent whose API key you configured.
- Open the
Agent-Weather-Toolagent. - Inspect the traces received from the example application.
View the resulting trace waterfall
The screenshot below shows the trace captured by E1 and visualized as a waterfall chart. It provides an overview of the execution timeline, making it easy to follow the sequence and duration of each operation, as well as the relationships between the agent, Gemini model invocation, andget_weather tool call.
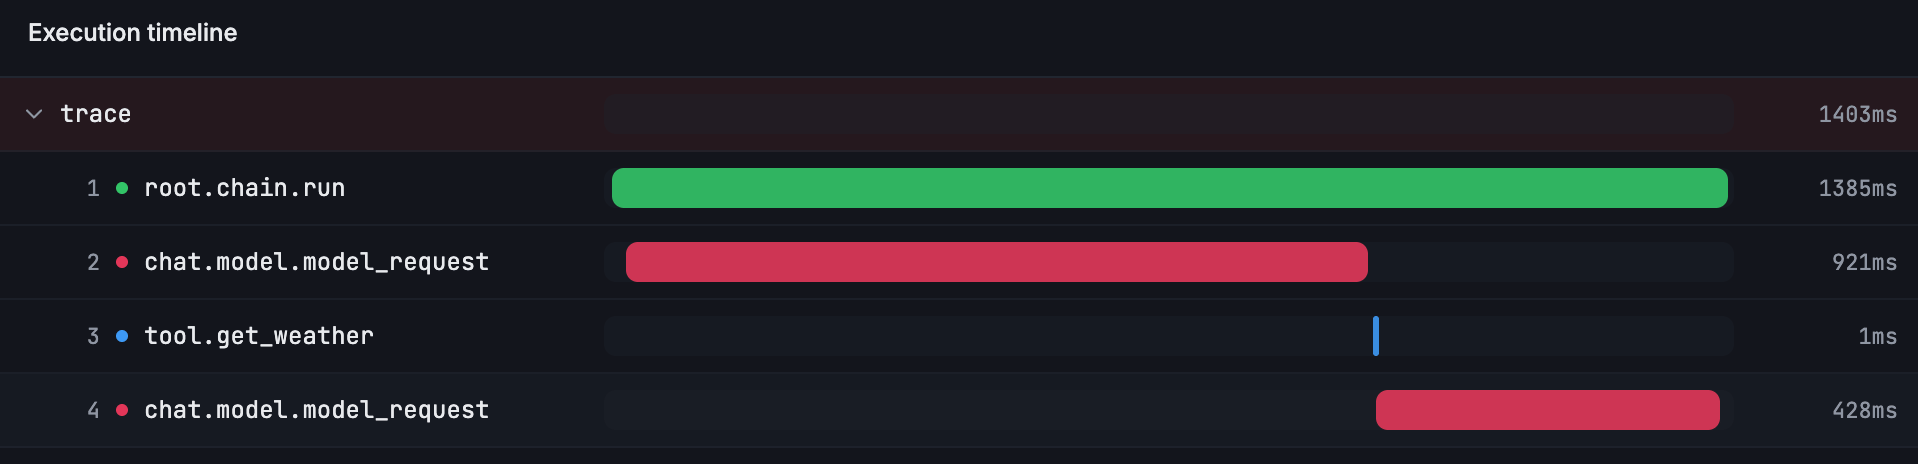
Weather Agent — resulting trace waterfall
Inspect and export the raw trace in the JSON viewer
You can also inspect the raw JSON data generated during the agent execution. The JSON viewer lets you explore the different data structures captured in the trace and export them for further analysis or debugging.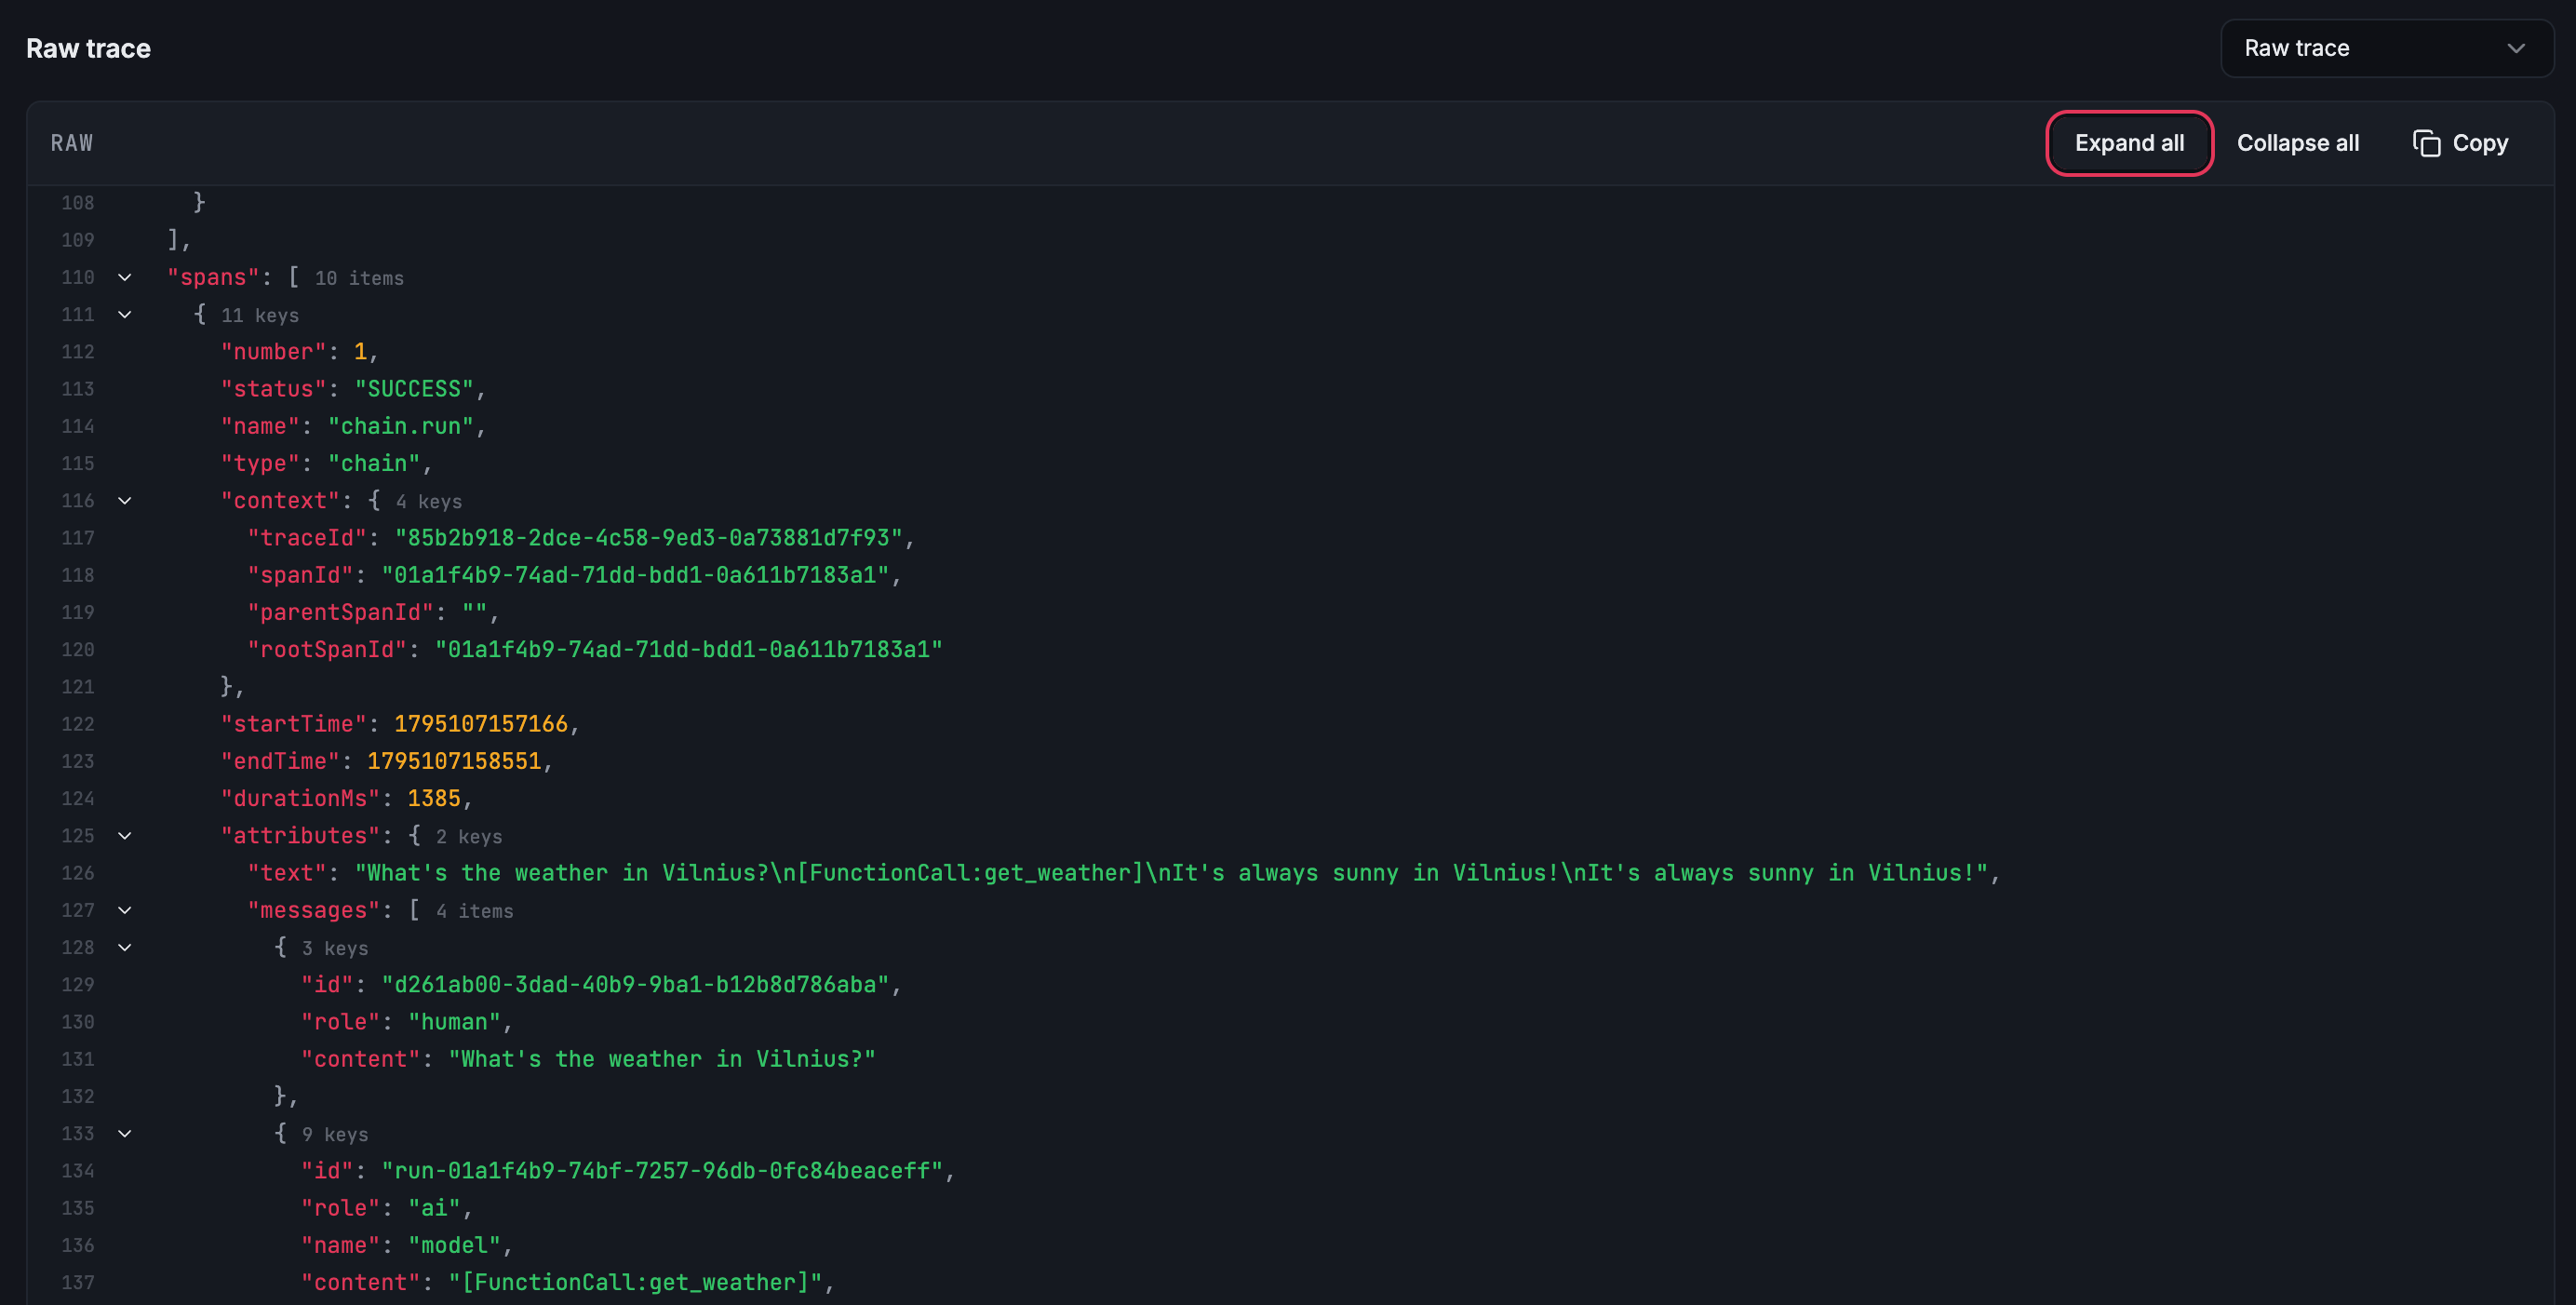
Weather Agent — raw trace in the JSON viewer
Explore detailed activity and cost breakdowns
Finally, open the associated activity details to review the cost breakdown for each model invocation. This view provides greater visibility into model usage and the costs associated with the agent execution.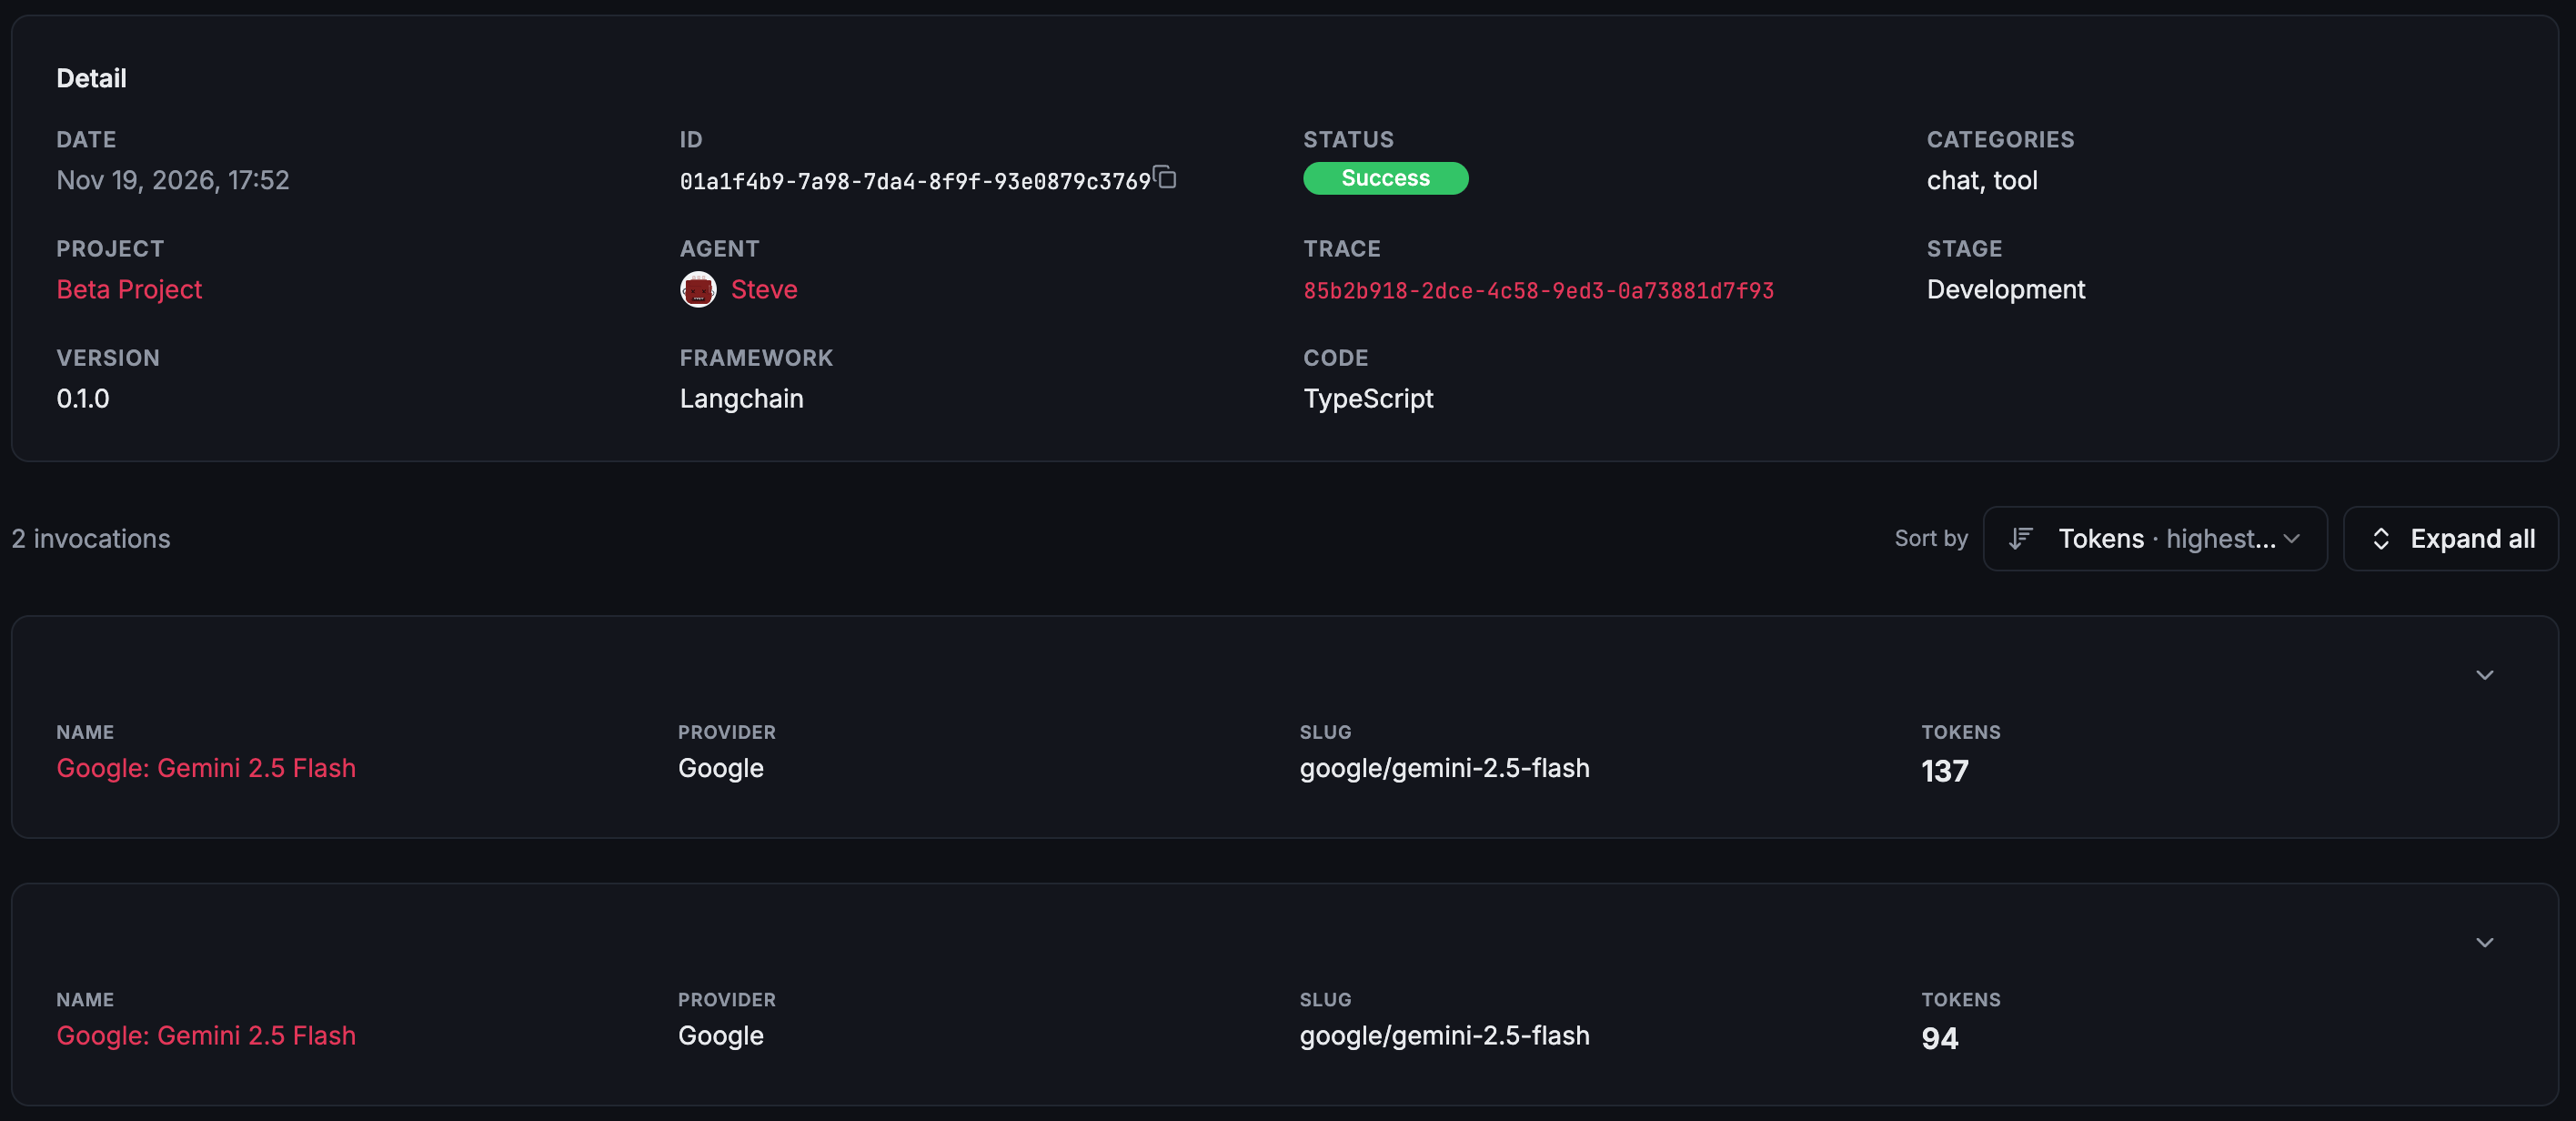
Weather Agent — detailed activity and cost breakdown
Explore the source code
The full example is available on GitHub:BlackNinjaGo/tool-agent-weather
Browse the complete TypeScript implementation, environment template and
project configuration.
What to try next
- Change the user message and observe another agent execution.
- Add another LangChain tool and inspect how its execution appears in the trace.
- Change the global tags or metadata to distinguish environments or versions.
- Replace the demonstration weather tool with a real weather API integration.